
6 minute read

The developers behind TradingView must be doing something right if more than 50 million traders use their service. Furthermore, according to several web analytics platforms, the site is currently the most visited for investing-related searches.
While TradingView is highly advanced, it takes little time for beginners to navigate and benefit from the software. Get yourself up to speed with our brief tutorial guide on using the TradingView app below.
About TradingView
TradingView is a supercharged financial market charting platform and social network founded in 2011. The company behind this exquisite software, TradingView Inc., has offices in New York and London.
Users can explore several traded assets, such as stocks, forex, cryptocurrencies, indices, futures, and bonds. TradingView also boasts a plethora of economy-related data across most continents. The former’s website is currently the most visited for investing-related searches, according to the latest data from SimilarWeb.
TradingView offers a free, ad-based plan and premium packages costing $12.95 to $49.95 monthly.
This software is available in browser, desktop, and mobile formats. This tutorial will focus on the browser version, where users can use the same skills to navigate the other versions easily.
The Basics of TradingView
While TradingView is integrated with many brokers and exchanges, the software layout remains the same. Users should create an account to gain all the benefits of the free plan.
Once on the homepage, click on ‘Markets’ at the top. Use the search bar to access all the available symbols on the latter page. Let’s use Bitcoin (BTC USDT) for all examples, as in the image below.

Choosing ‘See overview’ offers a basic chart, news, ideas, technicals, and related markets. Yet beginners should focus on the ‘launch chart’ since this is the most complex part of the TradingView app.
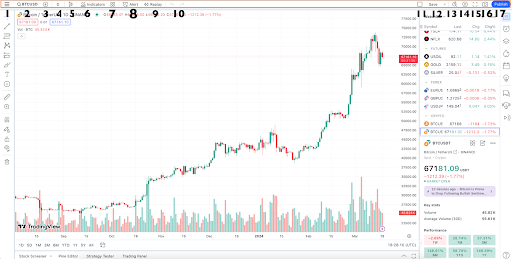
Here, we have a daily red and green candlestick chart of Bitcoin. Note the numbers and rectangles on the top, left, right, and bottom of the image above to understand each function better.
- This is where you can access the help center, learn about what’s new, toggle dark mode on/off, toggle the drawings panel on/off, choose your language, learn keyboard shortcuts, download the desktop app, and sign in.
- You can search for and open more markets by clicking the microscope icon next to the current symbol.

- This is where you can compare another market by overlaying its price movements on the current chart.
- Time-frames. TradingView allows one to view charts at several second, minute, and day intervals.
- Chart types. TradingView provides bar, candlestick, hollow candle, line, line break, area, baseline, columns, high-low, Heikin Ashi, Renko, Kagi, point & figure, and range charts.
- This tab is for indicators, where the software offers hundreds of standard and modified ones. In this section, you can input specific strategies, profiles, and pattern scanners.
The ‘Personals’ sub-tab is for creating custom tools using the software’s Pine Script programming language; the ‘Financials’ sub-tab is for financial metrics; the ‘Community’ sub-tab is for ‘scripts’ created by the TradingView community. - Accessing saved indicator templates.
- Setting alerts.
- Bar Replay function (only available on a paid plan).
- Undo and redo options.
Going to the top right corner of the chart, we have: - Chart layout.
- Saving and loading custom chart layouts or templates.
- Quick search function.
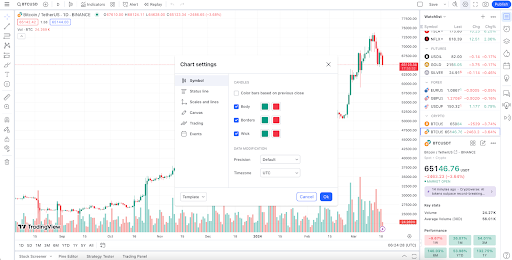
- Chart settings. TradingView offers users several visual customization choices. They can also edit the status line, scales, canvas, trading, and economic events options
- Full-screen mode.
- Screenshot.
- Publishing a trade idea in TradingView’s social network.
Drawing Tools

- Cursors (cross, dot, arrow, eraser, magic) – traders will use a cursor often to move their charts around).
- Lines, channels, and pitchforks.
- Fibonacci and Gann tools.
- Patterns, Elliott Waves, and cycles.
- Projection, volume-based, and measurer tools.
- Brushes, arrows, and shapes.
- Text, notes, and content options.
- Emojis.
- Measuring tool.
- Zoom in.
- Magnet mode.
- Stay in Drawing Mode.
- Lock All Drawing Tools.
- Tool hiding option.
- Remove hiding option.
Right-Hand Functions

- Watchlist, details, and news.
- Alerts.
- Object tree and data window.
- Hotlists.
- Economic and earnings calendars.
- My Ideas.
- Chats.
- Ideas Stream.
- Streams.
Bottom Functions
The functions at the bottom of the chart could be more beginner-friendly. Yet, for the sake of knowing them:
- Screeners: stock screener, forex screener, crypto pairs screener.
- Pine Editor.
- Strategy Tester.
- Trading Panel – this section is where you integrate a supported brokerage for a demo or live account.
TradingView’s Best Features for Beginners
By now, you should understand all the main functions of TradingView. Let’s review a few features any beginner can use to get the most out of the software.
Watchlists
Traders must inevitably organize the many markets available on TradingView. The best way is to segment each asset with a watchlist for clearer viewing. The paid plan allows users to allocate seven different colors for better organizing.
Setting Alerts
Alerts help notify you of price targets, economic news, and when certain technical conditions have been met. Traders don’t have to be at their charts waiting endlessly for a trading opportunity.
Accessing Historical Data
One advantage of TradingView is the platform’s richness in historical data. Traders can revisit price action from several months, covering a specific date or range.
Using The Data Windows
Viewing price information on TradingView is impressively responsive and fast using the cursor. The data window (on the right-hand side of the chart) is where you can view the open, high, low, and close prices, along with the volume and price changes. This helps set price levels accurately for support and resistance or general analysis.
Drawing Tools
Another splendid aspect of TradingView is the software’s broad range of drawing tools, from trend lines and geometric patterns to technical patterns and icons, with countless visual customization capabilities.
The TradingView App Is Perfect for Beginners
TradingView has successfully packaged competitive advancing charting capabilities that are manageable for beginners. It’s powerful, intuitive, and well-designed compared to other trading platforms. The best part is that even for some advanced traders, the free plan should be sufficient. A simple tip to avoid the ads is to use an ad-free browser, which results in an interruption-free experience.

