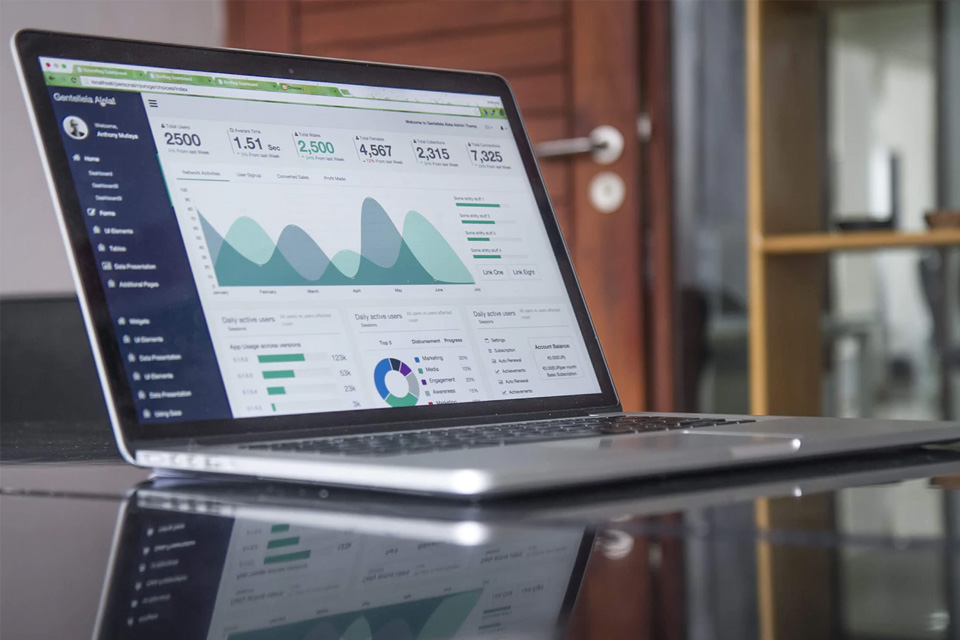
Managing finances, both personal and professional, can be highly confusing. Thankfully, there are plenty of resources online that can be used to help you manage your personal finances in 2020 and beyond. However, when you run a business or small company, dealing with finances becomes instantly more complex and difficult to manage. However, that is where Whatagraph’s Financial dashboard can help!
Everything you need to know about a Financial Dashboard.
When dealing with finance, you are likely going to be spending hour after hour looking at data. This can quickly become tiresome, especially as you have to keep track of all of the finances associated with your company, this includes:
- Revenue
- Income
- Working capital
- Investments
- Assets
However, when you use a financial dashboard, you will be able to find all of the information in one place, meaning that you can look over data with just the click of a button. This saves you valuable time, as you won’t have to waste hours scrolling through all of your files individually. Even better, the dashboard is easily accessible and compatible with a wide range of devices – meaning you can even review financial data from your mobile phone.
As a result, their financial dashboard is easy to use, even if you aren’t the most tech-savvy member of your team, and make use of platforms that you will already be familiar with, such as Google Sheets and Excel.
One of the most useful assets that comes hand in hand with a financial dashboard is the ability to quickly and easily create and deliver financial reports, that you can then share with the rest of your team, online or in person. As the dashboard updates itself frequently, you can ensure your reports are always up to date and insightful.
Furthermore, when you use a financial dashboard, you are also able to make smarter financial decisions for a number of reasons. For example, in addition to allowing you to quickly create financial reports, they also help you manage and understand your cross-channel analytics. This means you can gain a greater understanding of how your marketing is working for you and any changes you may need to implement. For example, you will be able to see:
- How many times people have searched for your company or business
- The number of times people have clicked on a link through your social media channels (Instagram, Facebook, Twitter, LinkedIn, etc)
- Who is clicking on your advertisements
- Who is making a purchase, and how they find your company (i.e, through social media, through advertisements, or through searching organically)
- What time of day people are looking at your content or making purchases
This information is invaluable in making better financial decisions in relation to your marketing scheme as you will gain a greater understanding of what is and what isn’t working. For example, there is no point in spending money on an advertisement that isn’t gaining you any exposure/money, your cash would be better spent creating a new advert, or running a different one that has earned you money previously.


